Hotels.com Research: “bad information”
How a quantitative observation inspired qualitative testing, and more than a 60bps increase in conversion.
Background
- As part of the UX team’s work to create a pattern library, we standardised font sizes for the desktop web applications.
- Rolling this out proved difficult, sometimes leading to changes we didn’t expect – but they weren’t problems big enough to delay releases.
- One such issue was a font size for prices. It appeared larger than we wanted it to be on the search results page.
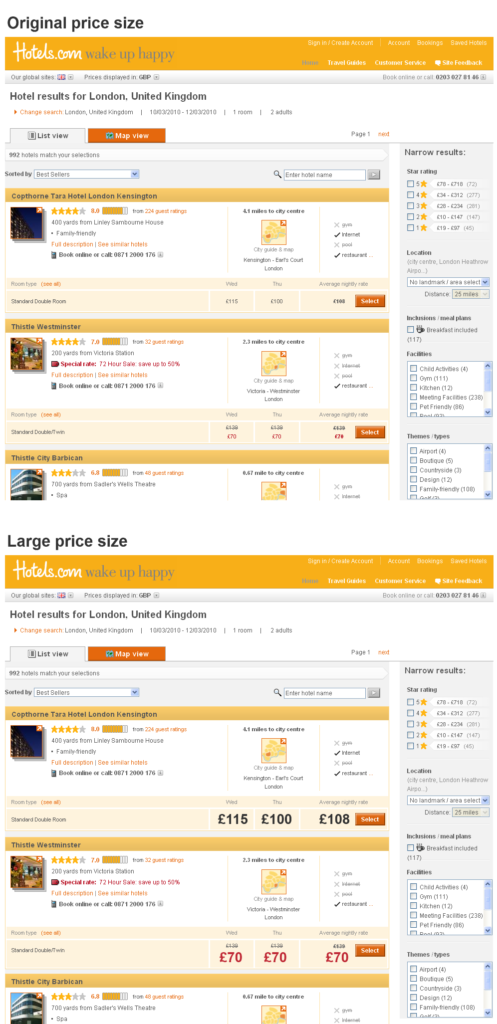
We thought the prices looked a bit too big
Numbers only tell you “what”, not “why?”
After going live, the analytics team noticed a mysterious but pronounced uptick in the conversion from the search results.
They concluded that the only significant change was the price font size. So they decided to make this change into a test, comparing the old, smaller design against the new, larger one.
Sure enough, there was a very big (60bps) conversion uplift. But why? We needed a hypothesis to test.
I discussed this with the UX and Product team. It seemed to be a function of prominence, but prominence alone needs a reason. We were interested in whether making other things prominent might also produce a similar effect.
So we came up with the following:
People appreciate “bad” things (like prices) being given prominence.
We assumed a font size wouldn’t be something that people would remark on much in a lab test. So we decided to look around for as many “bad” things to show in a “good” (prominent) way.
- Prices
- Taxes & fees
- Terms and conditions
- Notices about building work or closures
We created prototypes of designs that emphasised these things in the UI to see what effect it had, and made them part of qualitative tests over a number of months.
What this taught us
Ideally, you should use qualitative data to inform quantitative testing and vice versa. But when almost everything can be subject to testing against a hard KPI, it’s tempting to demote the (relatively expensive) activity of observing a few customers.
A purely quantitative approach to testing has two main weaknesses:
- It produces the “local maximum problem”
- It means everyone’s opinions on causes must be given the same weight.
The only way to solve the local maximum problem is to try to understand why something is happening by observing people and probing (mainly by asking “why?”). And a good research programme seeks to test lots of things over time. So we tested the “bad information” hypothesis along with unrelated project-specific ideas in continuous research to support or weaken that hypothesis.
Similarly with the second problem about opinion. I might think the reason for an uplift in conversion is sunny weather, you might think it’s faster site loading times or the influence of space aliens. So who is right? The test result itself cannot tell you. You have to attempt to find out through qualitative research and inductive reasoning.
Getting a useful result
Sure enough, in testing we saw people expressing appreciation about “honesty” and “impartiality”. So we probed into why this was. It was clear they thought the prominence was unusual, but in a good way that made them feel better about purchasing.
So it wasn’t just prices, it was anything that was “bad”. We now had a strong hypothesis.
Unfortunately, the hotel owners weren’t happy about emphasising bad news like building work or closures. But we proceeded with testing out larger pricing and clearer taxes and fees information across the site, raising the 60bps increase a little further to make one of the largest single increases in conversion we had ever seen.

Large pricing on the booking form a couple of years later.
Importantly also for the UX team, we now had a hypothesis on which to base future designs which thought might deal with “bad information”. Don’t hide that stuff – celebrate it!