Stake Graphs for Web Page Performance
I often complain that infoviz for web stats is poor if you’re not an analyst by trade. Now that I’m working for one of the most popular websites in the world, I should at least come up with a device that could be used to answer the fundamental questions we have when looking at real-time analysis of a news article:
- Is this article doing well?
- Is it likely to do better or worse from now on?
- Should we replace this article with another one?
Obviously, there are lots of other questions that need answering, but these are probably the main ones when it comes to news articles – our basic “unit” of content.
My thoughts turned to Stephen Few’s bullet chart (PDF) device for this. However, I made some variations to make what I’m calling a “stake graph” because it can look like a stake you might drive through the heart of a vampire. Or something.
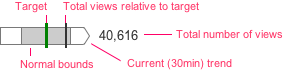
The reasons for the variations on Few’s bullet graph are as follows.
The black bar of the bullet graph is replaced by a black vertical line in the stake graph. This is to make comparisons between “stakes” easier, according to the guidance for using dot plots in place of bar charts (PDF)
The trend is indicted by making one or other of the ends of the “stake” into a point. Left for trending down, right for trending up. No points means it’s been flat. Stakes would need to be accompanied by some indication of the time period, which in our case is usually 30 minutes. I could use a sparkline for this, but in my experience these often distract people who aren’t used to them. A sparkline would be superior for longer time periods, but a simple up/down indicator seems to be what most people want given the short time periods we deal with.
The device is therefore symmetrical around a target value. Obviously, the way the target is computed isn’t clear, but I’m trusting we can come up with a useful measure for that. An example might be a median for all articles in that category for the time period, perhaps weighted by something like page position or age.
The bounds indicated could be computed from the target (eg a standard deviation away) or simply be to aid in spotting outliers (eg just marking out quartiles).
In this way, I’m hoping the device can be used, on its own or grouped, to answer the above basic questions.
To demonstrate the idea, here’s a quiz:
I initially read the graphs with stakes on the left in reverse. Presumably the movement towards the target always goes from left to right (0 is always on the left).
Charts with the stake on the left almost to convince my brain that 0 was on the right and the whole chart was going the other way.
Did you try thicker/thinner bars to represent more/less growth?
Ah good point – I’d made a left-to-right assumption. I can see how the trend indicator might tempt you into thinking it was also indicating the direction of scale.
At the risk of introducing more encoding, thicker vertical bars to indicate more traffic might be an idea in that case.
BTW of the people I’ve shown this device to, only about half have interpreted it correctly. Since stake charts are only very slightly different from bullets charts, I wonder if the latter suffers from the same lack of understanding?